Visualize, explore, and quantify with best in class rendering
Dragonfly 3D World ZEISS edition from Object Research Systems (ORS) is an advanced analysis software solution for 2D/3D data acquired by a variety of imaging technologies including X-ray microscopy and FIB-SEM. Using state-of-the-art volume rendering and access to advanced visualization techniques, Dragonfly 3D World ZEISS edition enables high-definition exploration into the details and properties of 3D datasets. Interactive inspection with color and opacity mapping means that in-depth analyses can always be visualized in meaningful ways and findings can be presented with easy-to-produce high-quality animated sequences.
Multi-scale and multi-modal data visualization
With Dragonfly 3D World ZEISS edition, file formats such as .txm and .czi can be read and include system spatial coordinates allowing for accurate dataset registration used in Scout and Scan and correlative workflows. Combined with data handling for time-dependent, 4D data.
Customize with Python scripting
Dragonfly 3D World ZEISS edition enables Python scripting - a powerful feature that allows users to customize their data processing and visualization needs. Users now have access to the data channels and properties within the interface creating a limitless and customizable post-processing environment. In addition, Dragonfly 3D World ZEISS edition uses Python with numpy, scipy and many other libraries standard with Anaconda distribution.
Easy to use
Dragonfly 3D World ZEISS edition is easy to use. With minutes of experience, you can explore, navigate, and annotate your dataset. In a few hours, gain control of more advanced tools such as image processing, segmentation, object analysis, and movie making. Use our compact, topic-specific
training videos to familiarize yourself with Dragonfly 3D World ZEISS edition in the shortest amount of time.
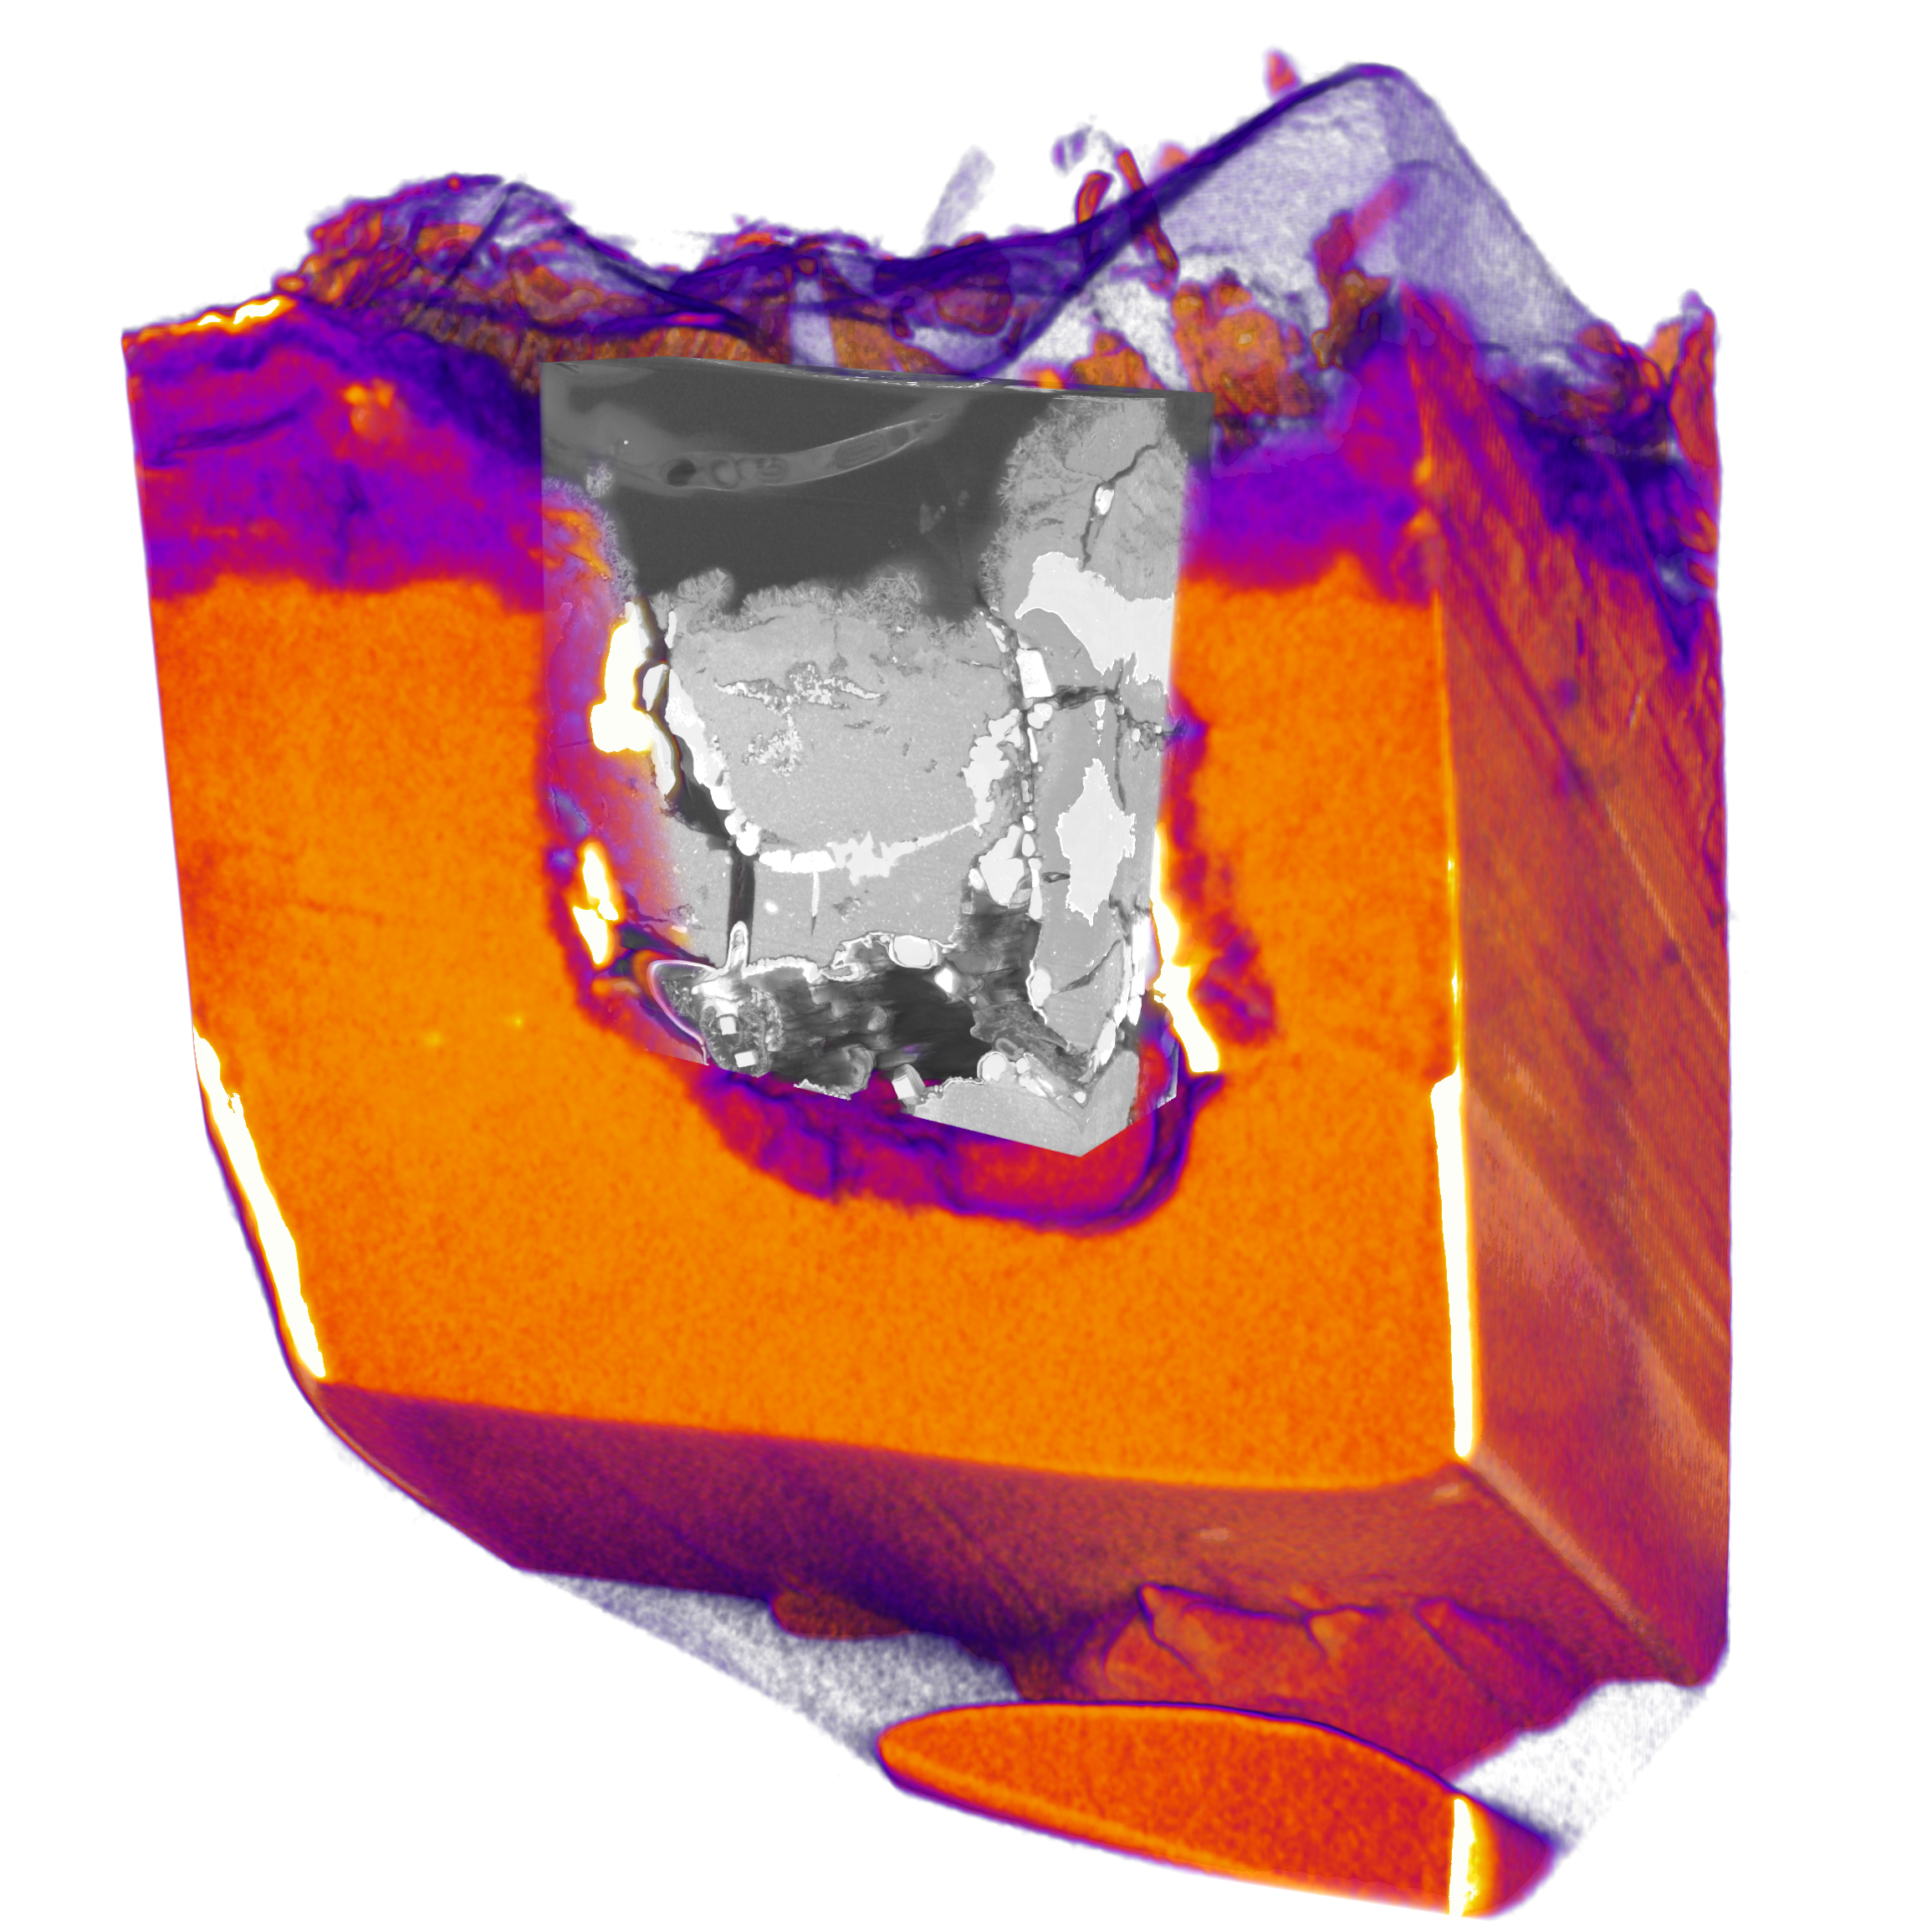
Multi-scale visualization of corrosion damage of a magnesium alloy. Imaged by ZEISS Xradia 810 Ultra and ZEISS Crossbeam 540. Courtesy of the University of Manchester
|
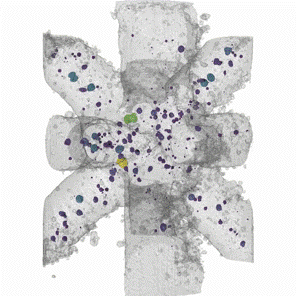
Visualization of an additive manufactured Inconel lattice with porosity color coded by volume.
|
Triple phase boundary calculation and interfacial mesh analysis
Spatial Network analysis for quantifications such as tortuosity and connectivity
Automatic object splitting and merging
Advanced segmentation using machine learning
Register and stitch 3D datasets
Auto-process module
High-impact visualization
- Apply visual effects, such as look-up table functions, regions of interest, multi-ROIs and meshes
- Freely inspect multi-planar slices
- Sharply define objects or features of interest with Focus and Depth of Field controls
- Easily adjust the opacity of all objects visible in 2D and 3D view
Image processing and segmentation
- Extensive image processing toolkit
   - Arithmetic filters
   - Smoothing
   - Morphology
   - Edge detection
   - Shading correction
   - Contrast adjustment
   - Sharpening
   - Threshold techniques
   - Texture analysis
- Apply intuitive masking operations
- Advanced segmentation tool options
Correlative ready
- Bring multiple datasets into the same workplace supporting ZEISS Scout and Zoom multi-modal techniques
|
Analyze
- Study volume metrics including porosity, particle/void analysis
- Measure surface areas
- Measure min, max, and mean intensity values and standard deviation
- Profile intensity distribution within selected areas
Import data
- 2D/3D and time dependent (4D)
- Image formats: ZEISS TXM, ZEISS CZI, TIFF, BMP, RAW, DICOM
- Mesh formats: 3D studio Max, ASCII, BREP, CS FDB, DirectX, IGES, OBJ, PLY, STEP, STL, VRML, VTK polydata (VTK), VTK polydata XML (VTP), VTK unstructured grid (VTK), Mesh, ORS XML
Export data
- Image formats: TIF, DICOM, ZEISS CZI, BMP, JPG, PNG, DDS, DIB, HDR, PFM
- Mesh formats: Direct X, OpenInventor 2.0, STL, VRML, WaveFront, VTK, MESH, ORS XML, PLY
- Save session: XML
- Save high DPI poster-size images in a variety of formats
- Save high definition movie sequences as gif, avi, and wmv
|
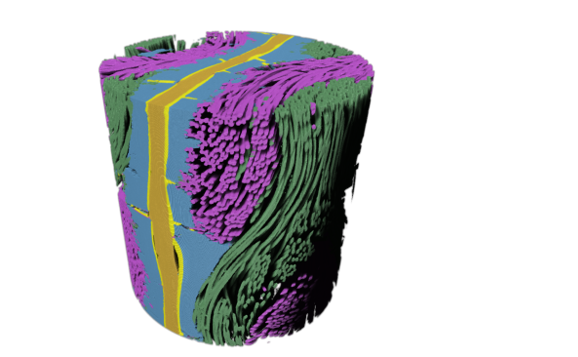
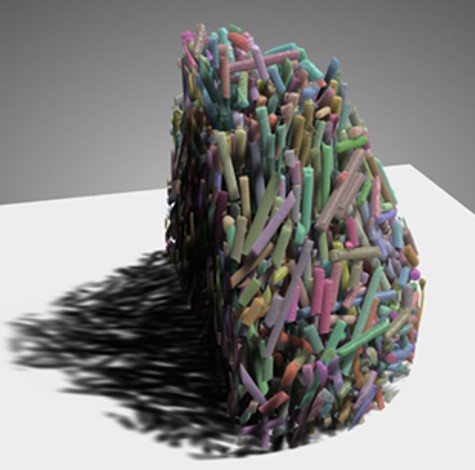
Individually segmented fibers with virtual floor rendering.
|
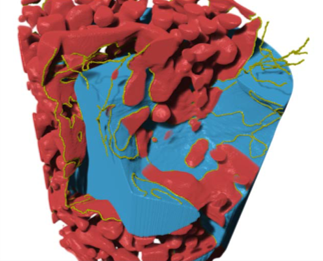
Triple Phase Boundary calculation (yellow) of solid oxide fuel cell allows for accurate metrics of length, interfacial surface area and local tortuosity. Imaged on ZEISS Xradia 810 Ultra. Courtesy of the Colorado School of Mines.
|
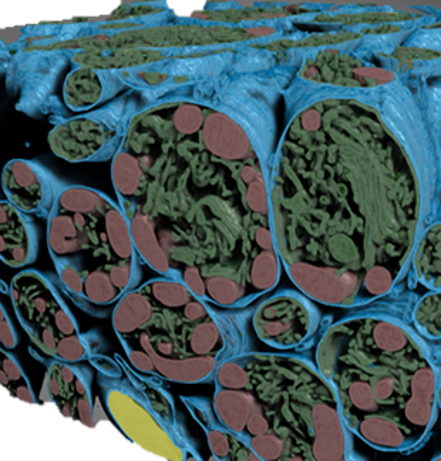
Auto-process enables real-time processing of serial section 2D stack experiments. Apply filtering, segmentation, registration and predefined macros. Mammalian cell with mitochondria and ER segmented. Imaged on ZEISS GeminiSEM 3View. Courtesy of the Cross Cancer Institute.
|
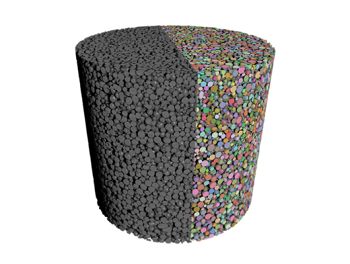
Automatic object splitting allows for individual particle analysis of metrics such as volume, surface area, orientation, sphericity and many more! Use Python to create your own metric! Imaged on ZEISS Xradia 620 Versa.
|
Deep Learning module
Harness the power of convolutional neural networks, realized through cutting edge artificial intelligence engines to advance your image processing results to new levels.
Powered by Google’s TensorFlow and Keras, Dragonfly 3D World ZEISS edition gives users the power to develop new neural networks, but also to train, reuse, and repurpose existing models for advanced applications that will revolutionize your workflows.
Dragonfly 3D World ZEISS edition’s trained neural networks behave like image filters, this makes them easy to preview, fast to apply, and simple to share for reuse. Dragonfly 3D World ZEISS edition’s Deep Learning solution is bundled with pre-built and pre-trained neural networks, implementing such powerful solutions as UNet, DenseNet, FusionNet and many others.
The latest version release features a number of enhancements for Dragonfly 3D World ZEISS edition's ground-breaking Deep Learning Module, including support for multiple channel inputs, elastic deformation on patches, training data statistics, a model evaluation tool, and much more.
Bone Analysis Module
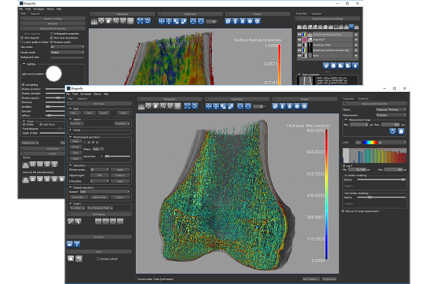
Analyze bone micro-architectures using semi-automated workflows. Designed for evaluating high-resolution micro-CT image data, the Bone Analysis Module provides 3D vector-based mappings of anisotropy magnitude and directionality and 3D scalar-based mappings of volume fraction. In addition, an automated separation of cortical and trabecular bone drives the calculation of common bone morphometric indices.
Check out the
technical note for more detail
|
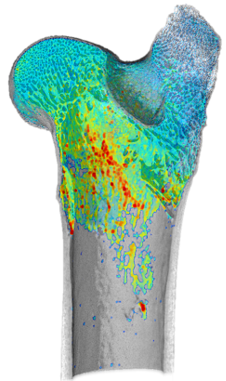
Volume thickness map of trabeculae
|